Pillar Dashboard — Accessible React Admin Dashboard Template
A production-ready, accessible admin dashboard template built with React, React Router DOM v6, SCSS, and Pillar UI. Created by expert frontend developer Hamza Miloud Amar for developers and startups.
Overview
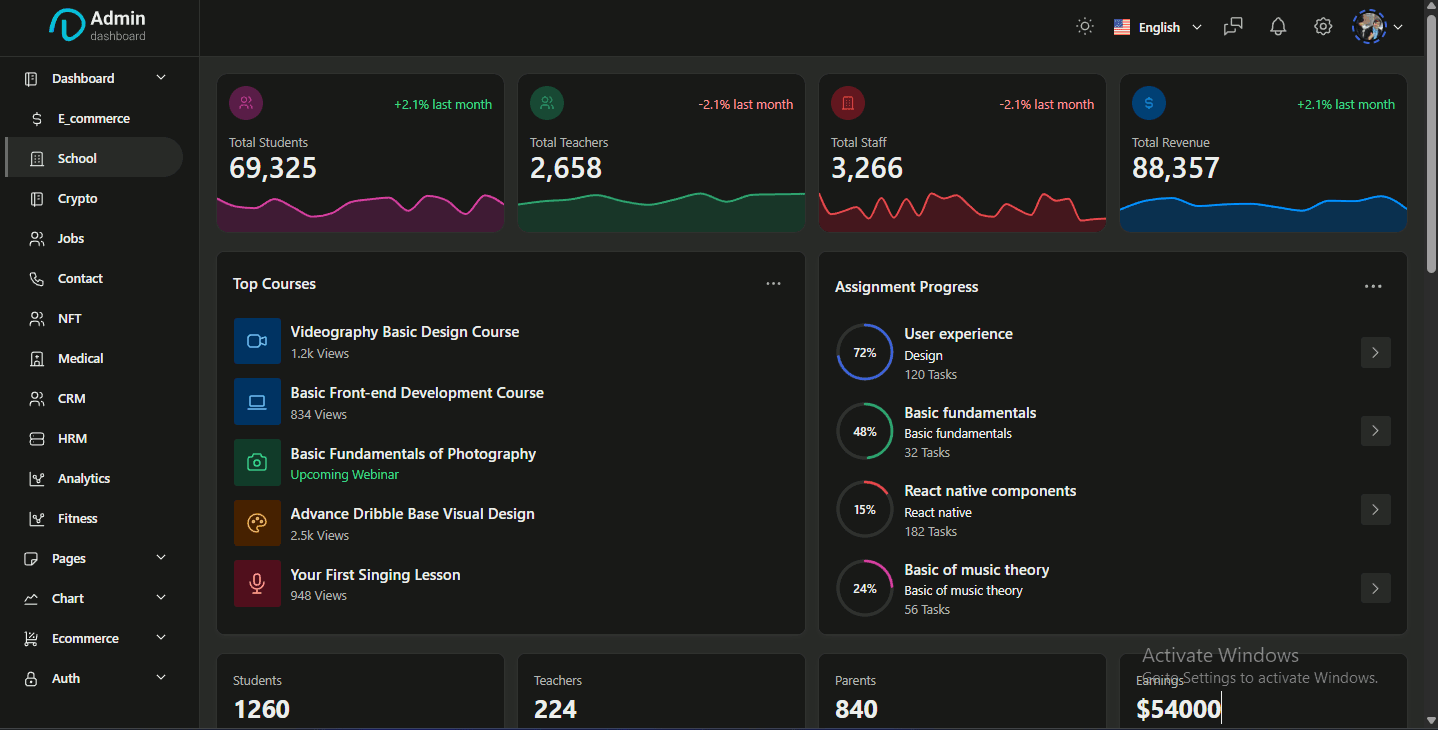
Pillar Dashboard is a production-ready admin dashboard template I built as an expert frontend developer to demonstrate the power of my Pillar UI component library in real-world applications. It provides developers and startups with a complete, accessible, and customizable admin interface that can be deployed within hours rather than weeks.
The Problem
Building admin dashboards from scratch is time-consuming and repetitive:
- Reinventing the wheel — Every project needs tables, forms, charts, and navigation
- Accessibility overlooked — Most templates fail WCAG compliance
- Inconsistent design — Piecing together components from different sources
- Poor performance — Heavy templates with unnecessary dependencies
My Role
As the sole expert frontend developer, I:
- Architected the component structure and routing system
- Implemented 15+ pre-built pages with real-world data patterns
- Ensured WCAG 2.1 AA accessibility compliance throughout
- Created responsive layouts for desktop, tablet, and mobile admin use
- Optimized for Core Web Vitals and performance
Technical Stack
| Layer | Technology | Purpose |
|---|---|---|
| Framework | React 18 | Modern component-based UI |
| Routing | React Router DOM v6 | Declarative routing with nested layouts |
| UI Library | Pillar UI | Custom accessible component primitives |
| Styling | SCSS + CSS Variables | Maintainable, themeable styles |
| Charts | Recharts | Interactive data visualizations |
| Tables | React Table (TanStack) | Sortable, filterable, paginated tables |
| Forms | React Hook Form + Zod | Type-safe form handling and validation |
| Icons | Lucide React | Consistent, lightweight iconography |
| Deployment | Vercel | Fast global CDN delivery |
Page Inventory
Dashboard Pages
- Ecommerce — Sales metrics, revenue charts, recent orders, top products
- Analytics — Traffic sources, user behavior, conversion funnels
- CRM — Customer pipeline, contact management, deal tracking
- HRM — Employee directory, attendance, payroll overview
Base UI Pages
- Buttons — All variants, sizes, states, and icon combinations
- Forms — Inputs, selects, checkboxes, radios, switches, file uploads
- Data Display — Tables, lists, cards, avatars, badges
- Feedback — Alerts, toasts, modals, progress indicators
- Navigation — Tabs, breadcrumbs, pagination, menus
Utility Pages
- Authentication — Login, register, forgot password, OTP verification
- Error Pages — 404, 500, maintenance mode
- Settings — Profile, account, notifications, billing
Accessibility Features
- Keyboard Navigation — Full tab order and focus management
- Screen Reader Support — ARIA labels, live regions, semantic HTML
- Color Contrast — WCAG AA compliant color palette
- Focus Indicators — Visible focus rings on all interactive elements
- Reduced Motion — Respects
prefers-reduced-motionsettings
Key Features
- 15+ Pre-Built Pages — Ready to use or customize
- Dark/Light Mode — Toggle with CSS variable theming
- Responsive Sidebar — Collapsible navigation with mobile drawer
- Interactive Charts — Line, bar, pie, area charts with real data
- Advanced Tables — Sorting, filtering, pagination, row selection
- Form Validation — Real-time validation with error messages
- Type-Safe — Full TypeScript coverage
Challenges & Solutions
Challenge 1: Chart Performance with Large Datasets
Rendering hundreds of data points caused lag. I optimized by:
- Data sampling for overview charts
- Lazy loading detailed views on interaction
- Canvas-based rendering where SVG struggled
Challenge 2: Accessible Data Tables
Tables are notoriously difficult for screen readers. I implemented:
- Semantic
<table>structure with proper<th>scope attributes - ARIA labels for sort buttons and pagination
- Keyboard shortcuts for common table operations
- Row selection with announced state changes
Results & Impact
- Accelerated development — Teams report 5x faster admin UI setup
- Showcases Pillar UI — Real-world demonstration of component library capabilities
- Learning resource — Used by junior developers to study React patterns
Future Plans
- Add Next.js App Router version
- Integrate with popular backend templates (NestJS, Supabase)
- Add more industry-specific pages (healthcare, education, SaaS)
Need a custom admin dashboard for your SaaS or internal tool? Contact me to discuss your project.
Your support helps me create more helpful content. If you enjoyed this, please consider buying me a coffee.